In this blog post, I will talk about how to build and annotate your own maps in javascript without using any libraries. One question you might ask is, why would’t I use some library like leaflet.js which makes my job easier and faster?
From what I’ve seen, it’s a difficult process if you want to create your own maps and have them annotated. You will either pay money or spend your days finding open sources online. Say, you live in Birmingham,AL where there aren’t a lot of options to use the county maps to generate user events. Now you’re stuck right?
Nope.
I’m here to tell you the process of creating maps and annotating them in JS is actually quite simple.
-
Get an image of the map preferably in .svg format. Why .svg? because the format is already a two dimensional vector format with built in options for interactivity and customization. If you have any other format, say .png you can use this great website to convert it into .svg format. https://www.pngtosvg.com/
-
Get the code for your svg image at: http://editor.method.ac/
Click File >> open SVG. The click on the view tab >> Source.

3 . The next step is to convert your .svg into a vector map which is basically javascript. This tool here lets you convert your svg into vector map. http://svg.wangxingrong.com.
Copy the source code from the step above and paste it in tool and let it work it’s magic. Give it some time you should get a jvector map soon which looks annotable.
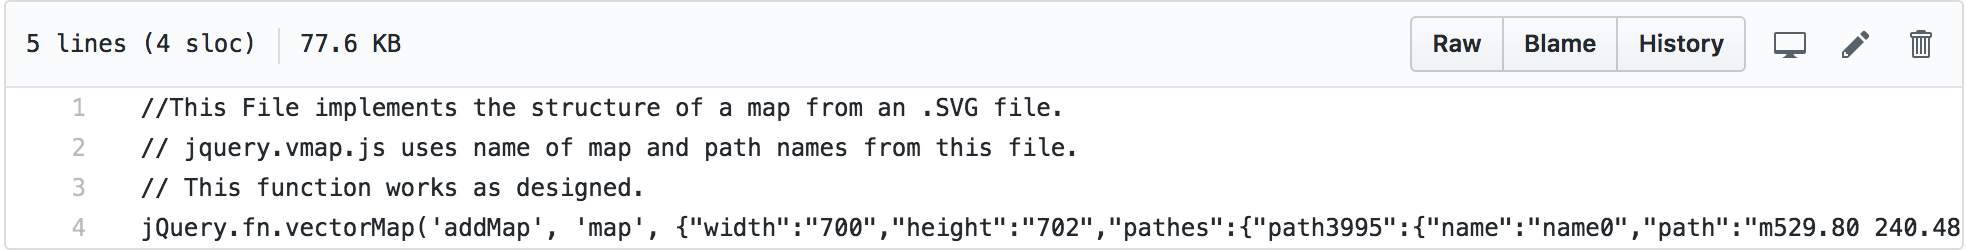
Click on save and you should get the entire source code in JvectorMap. Copy the code and add it to a javascript and name it. I named my file jQueryVectorMap.js
There are some changes you need to make in the file. Make sure you change the word “paths:” to “pathes:”. Thats it for the this file. Make an html page and create a div and set its id to ‘map’. You can name it anything just make sure to change it in the .js file too.
Now to annotate the file, you can download the file from github link,
**Github**
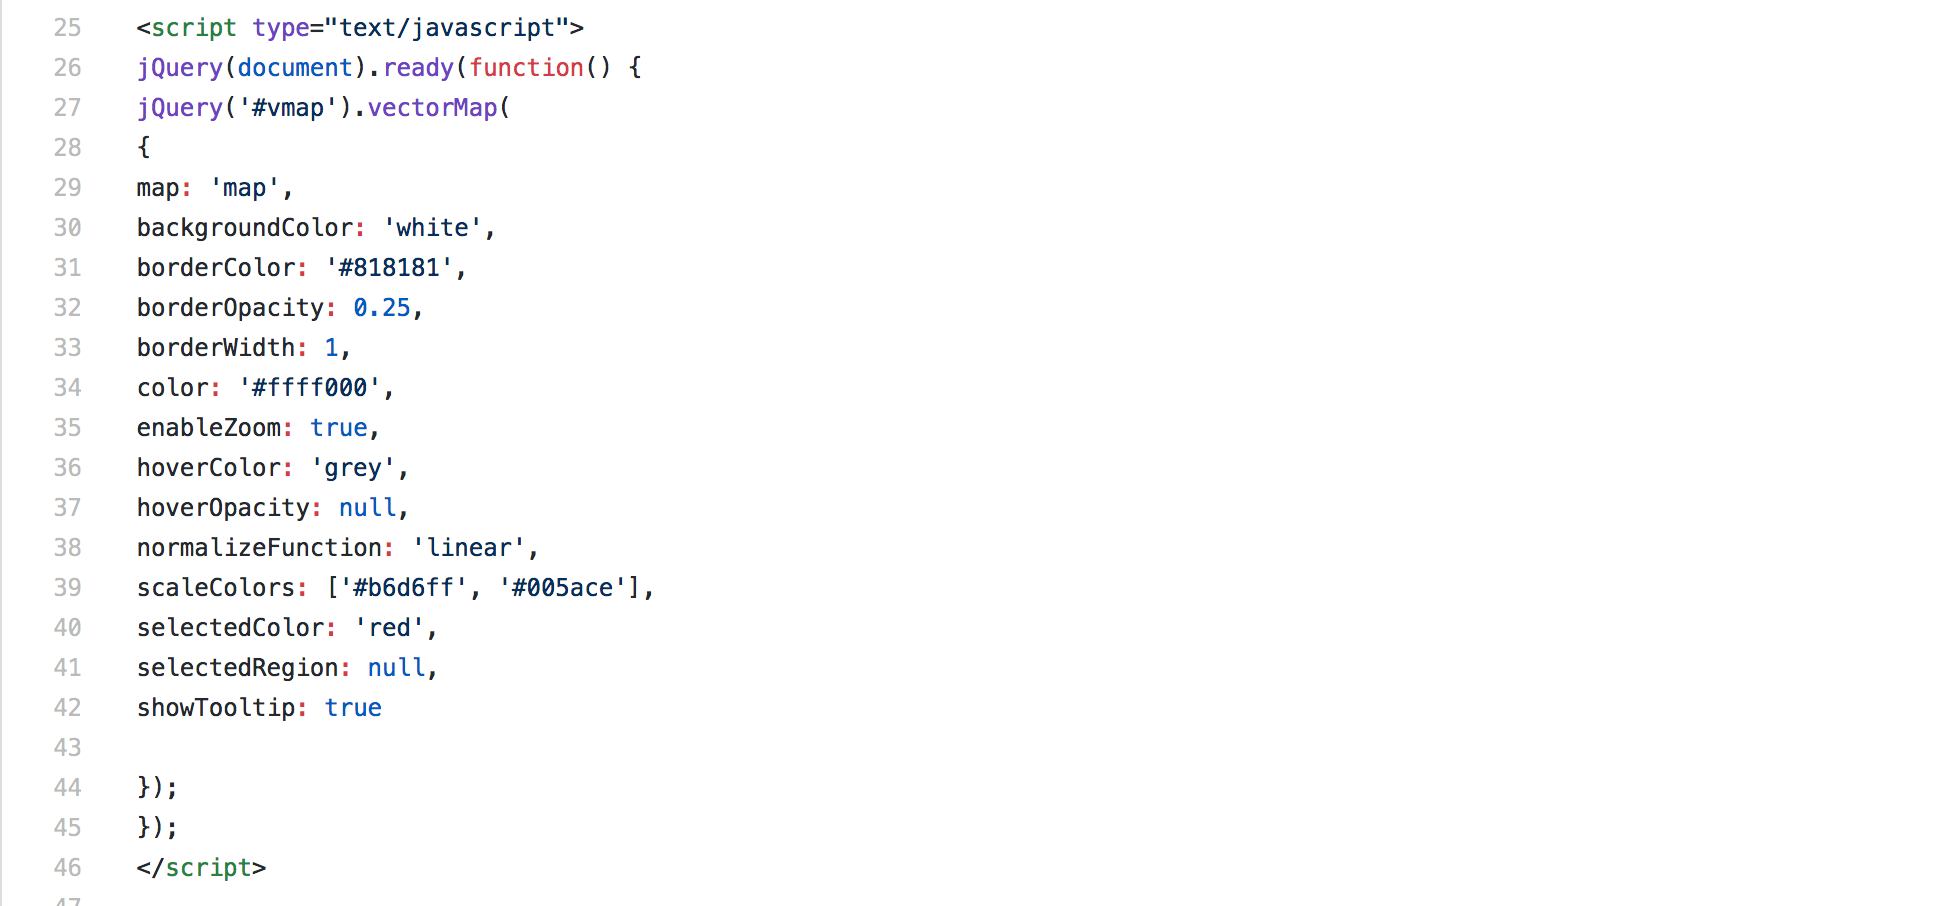
Edit the file jquery.vmap.js as you wish to annotate. You can find all sorts of events, such as mouseover click etc. You can also parse this map to other libraries now to create more interactivity.
Make sure to add:

Thats it. Three files and you’re done.
I built similar maps for the city of Delhi,India for which you can find the source code here : source code
I also deployed a live demo on heroku for basic events such as hover, click and highlight events : Demo.